
Last week I was on a busy highway, crawling along, and we drove past a metered on-ramp, where there is a stoplight controlling how fast cars can get onto the highway. The person sitting beside me made the comment “that thing isn’t doing anything”, which prompted a conversation about what it was supposed to be doing.
By the time we got there, the traffic was heavy enough that the metered on-ramp truly wasn’t doing anything useful anymore. We had already exceeded its ability to make a difference to the flow of the traffic. The key is what the metered on-ramp had been doing earlier and how its presence kept the traffic more reasonable for longer.
The highway is a queueing system, just like a telephone call centre or the workflow through your team, and like any queueing system it has certain known behaviours. As utilization goes up (number of cars on the highway) we eventually reach a tipping point. Below that point, the system is moving quickly and effectively (getting cars to their destination). Above that point, the higher the utilization, the worse the system performs. I’m told that for a highway, that tipping point is about 60% capacity.
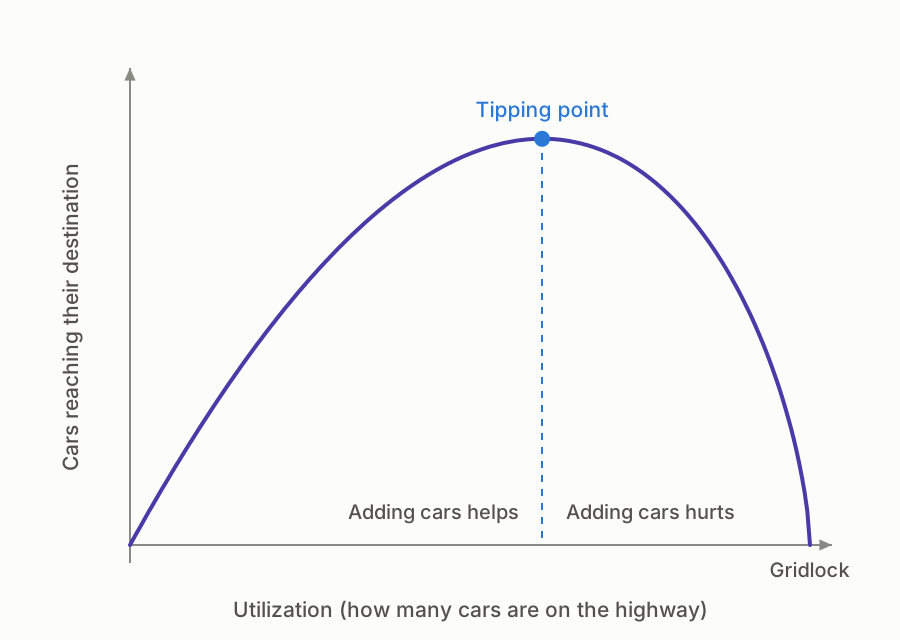
The thing we care about is that if we can keep the number of cars below a certain point, the highway is very effective. Once it gets above that point, the highway gets less and less effective. Those stop lights on the metered on-ramp are trying to keep the number of cars on the highway below that point. For a while that had succeeded on this highway and then we reached the point that too many cars were already there and we just got slower and slower.
A quick note on terminology: The utilization (number of cars on the highway) is also called resource efficiency and that’s the name I usually use. The measurement of how many cars get to their destination is also called flow efficiency. The fact that they’re both “efficiency” can be confusing and cause us to talk past each other.
We can model this mathematically with Kingman’s formula.
Kingman’s formula
In 1961, John Kingman published an approximation for how long things wait in a queue.1
“Kingman’s formula, also known as the VUT equation, is an approximation for the mean waiting time in a G/G/1 queue. The formula is the product of three terms which depend on utilization (U), variability (V) and service time (T).”
Wikipedia, “Kingman’s formula”1
Three things multiplied together. How busy the system is, how variable the work is, and how long one item takes to handle.
It’s an approximation, not an exact result, and it describes a single server. It’s at its most accurate when the system is close to saturation,1 which is fine for our purposes, because close to saturation is where most teams live.
The busyness term
The first term is utilization divided by one minus utilization.
This measures something different from the curve at the top of the post. That one was how many cars reach their destination, which rises to a peak and then falls away. This one is how long each item waits, and it has no peak at all. It climbs, and the climb gets steeper the busier we get.
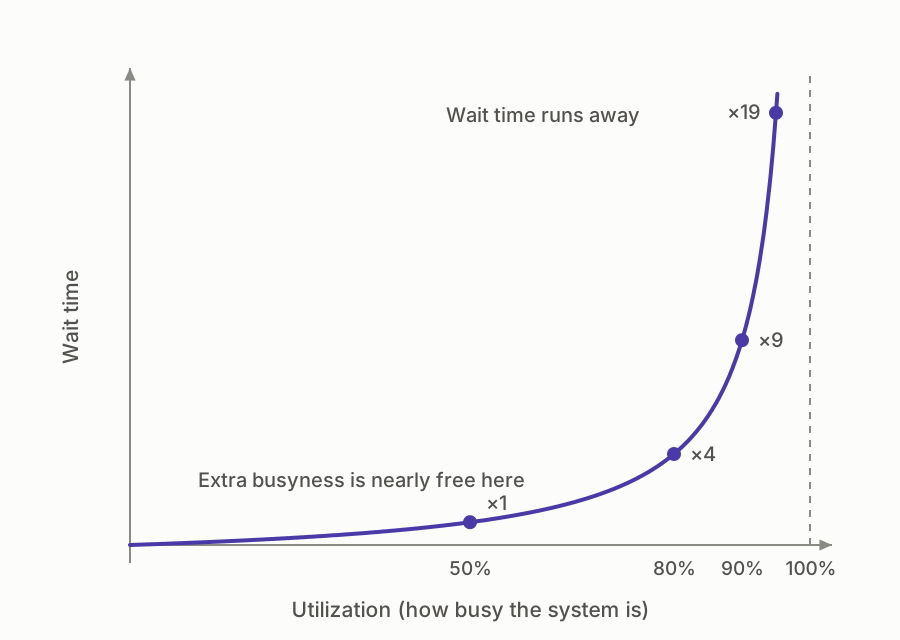
Going from half busy to 80% busy multiplies the wait by four. Going from 80% to 90% more than doubles it again. The next five points double it a third time. At 100% utilization the divisor is zero and the wait is infinite, which is the arithmetic saying that nothing ever arrives.
The last ten points of utilization have more impact than the first eighty combined.
I’ve made this argument before: Keeping people busy walks through what happens to a highway as you add cars, and why a fully utilized system delivers nothing. This is the same claim with numbers attached to it.
So what can we do with that?
Both terms are more under our control than they feel.
Utilization looks like somebody else’s decision. We didn’t pick the headcount and we didn’t pick how much work shows up. What we do pick is what we start, and work arriving is not the same thing as work started. A team that starts everything the moment it lands has given away the one piece of utilization it genuinely controls.
In the case of team workflow, I usually start with these:
- Learning to say no when the request is in front of you.
- Slowing the arrival rate with explicit policies.
- Working around the secondary gain that keeps us starting things anyway.
The second is exactly the metered on-ramp. It doesn’t let every car get started onto the highway right away. It controls that flow.
The variability term
The second term is the one that matters more to a development team.
Variability here means how uneven the work is: how much the gaps between arrivals vary, and how much the time to handle each item varies. Two teams can sit at exactly the same utilization and see completely different wait times, purely because one team’s work items are all roughly the same size and the other team’s range from half a day to six weeks.
The coefficients of variation in the formula are squared, so this pays off faster than it looks. Halve the variability in your work and you cut the wait to a quarter, at the same utilization, with nobody working any harder.
Variability is the second lever, and it’s the one that doesn’t get discussed as much. We can improve things by slicing the work in roughly equal sizes.
There is a real gotcha when slicing by size though, and I talk about that in slicing stories. A story must be valuable and should be small, and when those two fight, valuable must win. When we slice the work to fit an arbitrary timebox and we end up with pieces nobody wanted, which is optimizing for busyness rather than effectiveness. Kingman doesn’t reorder that. It tells us what uniformity is worth once we’ve found the real value boundaries, and the same discipline applies at larger sizes with slicing epics.
If an item can’t be made smaller without losing its value, that’s how big it needs to be. The variability it adds is a cost we accept, not a slicing failure.
Similar sized pieces speed up the queue without anyone working harder. Slices that carry no value just move nothing faster.
Back to the on-ramp
The metered on-ramp does both halves at once. It keeps the mainline off the steep part of the utilization curve, and it converts a lumpy burst of eight cars all merging together into a steady trickle of one at a time, which is the variability term.
By the time we got to the metered on-ramp, the highway was already past the tipping point and it was running slow. The on-ramp wasn’t helping anymore, but it certainly had been helping earlier in the day.
See also:
- Keeping people busy. What over-utilization does to a system.
- Wait states. Where the time in a workflow actually goes.
- Slicing stories. Why value wins over size when you split work.
- Learning to say no. The team that agreed to stay focused and then didn’t.
-
Kingman’s formula, Wikipedia. The original paper is J. F. C. Kingman, “The single server queue in heavy traffic”, Mathematical Proceedings of the Cambridge Philosophical Society, 57(4): 902, October 1961. ↩ ↩2 ↩3